The same system is studied at increasing time resolution.
Stage 1 · Hourly
How much energy and capacity?
8,760 hourly steps · one full year
Optimal dispatch of PV and turbines against the annual load profile. It sets the system requirements: number of machines, adequacy, curtailment and cost.
Output: system requirements
Stage 2 · Minute
Can the machines follow the load?
1-minute steps · two summer weeks
Adds the minute-by-minute load of AI training, turbine ramp limits and minimum load, and the system inertia of every minute. It shows the events the system cannot cover, how fast a response must be, and what a third machine or a battery changes.
Output: dynamic requirements
Stage 3 · Loss of a source
What if a machine trips?
Milliseconds around one event
Tests the sudden loss of a turbine at peak load (N-1), with the inertia and the fast headroom of that moment, to see whether the frequency can be arrested.
Output: protection requirements
Each stage uses finer data only where the previous one cannot answer the question.
The system
An islanded data center supplied by PV and gas turbines
No grid connection: every kilowatt consumed must be generated on site, second by second.
The system · Turbine
Centaur 40: the datasheet values that set the rules
Capacity, minimum load and ramp rate drive every result that follows.
Parameter
Value
Role in this study
Rated output (ISO)
3,515 kWe (≈ 3.5 MW)
Capacity per machine: two units give 7.03 MW, three give 10.55 MW.
Electrical efficiency / heat rate
27.9 % LHV · 12,910 kJ/kWh
Fuel burned per kWh. It worsens at part load, which is why running extra machines costs fuel.
Minimum stable load
≈ 1.0–1.4 MW (30–40 %)
A running machine cannot go below this: more machines online means a higher floor for PV to fit under.
Emissions-compliant min.
≈ 1.4–1.8 MW (40–50 %)
Practical lower limit when emissions must stay compliant (SoLoNOx).
Normal controlled ramp rate
0.3–1.5 MW/min
Datasheet range. In the two-turbine results unserved energy occurs only with both machines at full rating: capacity is the limit, not ramp rate.
Fast start package
< 35 s cold to full load · ≈ 6 MW/min
Starting a stopped machine is fast, but it does not help a machine that is already running.
Block load acceptance
100 % (full 3.5 MW step)
Accepted without significant power-quality impact.
Fuel
Natural gas, dual-fuel capable
Gas is the base case; liquid fuel is an option.
The load · IT
The raw server load: AI training in bursts
LLM training load of one 1 MW UPS group · one hour at 1-second resolution · before UPS smoothing
Resolution1 second
Idle level≈ 200 kW
Burst level≈ 650–700 kW
Bursts in the hourabout 17
Burst duration10 s – 2 min
Raw data before UPS smoothing, one hour at 1-second resolution. The following slide shows the same kind of workload as seen at the UPS input, at 1-minute resolution.
The load · IT
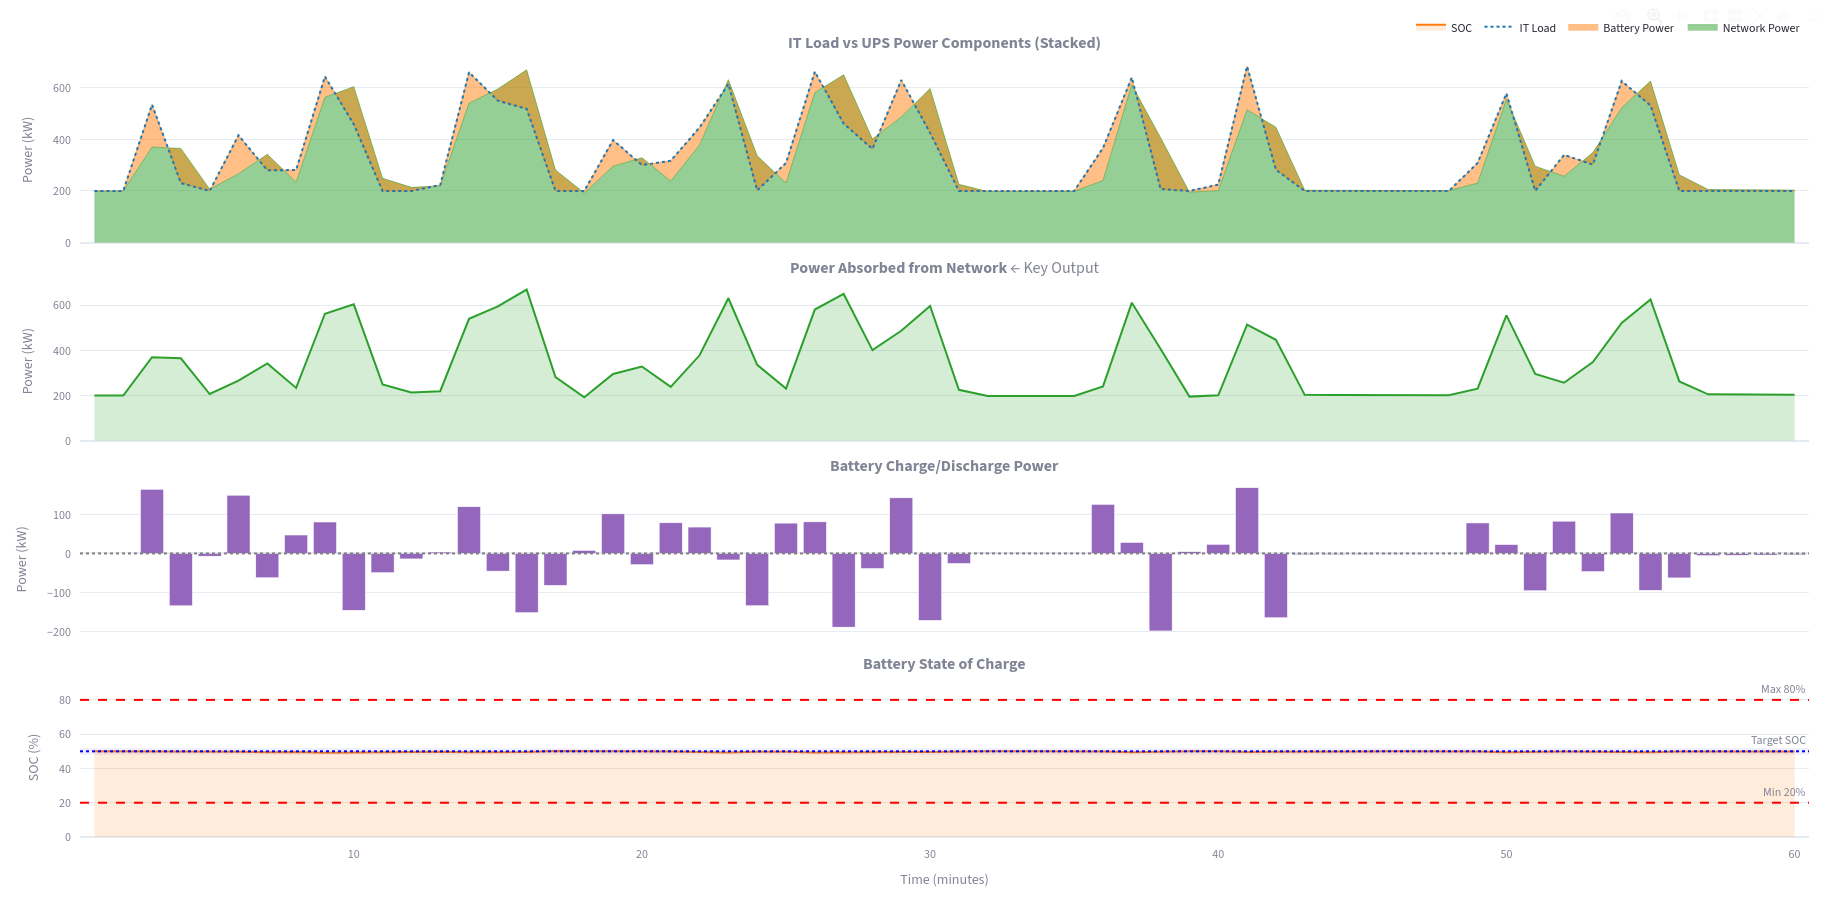
The same load seen through a UPS
ABB Megaflex 1000 kW, 415 V · 60 minutes at 1-minute resolution · after UPS smoothing
The load · Auxiliary
Auxiliary load: from connected load to effective demand
Load
Connected (kW)
Diversity
Ks
Effective (kW)
CRAH / CRAC fan motors
900
0.85
0.90
688.50
Chilled water pumps (primary + secondary)
600
0.80
0.85
408.00
Condenser water pumps
330
0.80
0.85
224.40
Cooling tower fans
240
0.75
0.80
144.00
Chiller compressors
1,350
0.85
0.90
1,032.75
UPS / PDU cooling fans and pumps
165
0.70
0.75
86.62
AHU / make-up air fans
132
0.75
0.80
79.20
Fire pump and jockey pump
180
0.30
0.20
10.80
Lighting and small power
120
0.90
0.95
102.60
BMS, security, monitoring
60
0.85
0.90
45.90
Generator auxiliaries (fuel pumps, fans)
90
0.40
0.30
10.80
Total
4,167.0
2,833.6
The load · Auxiliary
Where the auxiliary energy goes: the cooling chain
Mean load contribution per equipment group, from the load table above
This chart is redrawn from the load table because the original export cut off some labels. Values and shares are those of the table.
The load · Auxiliary
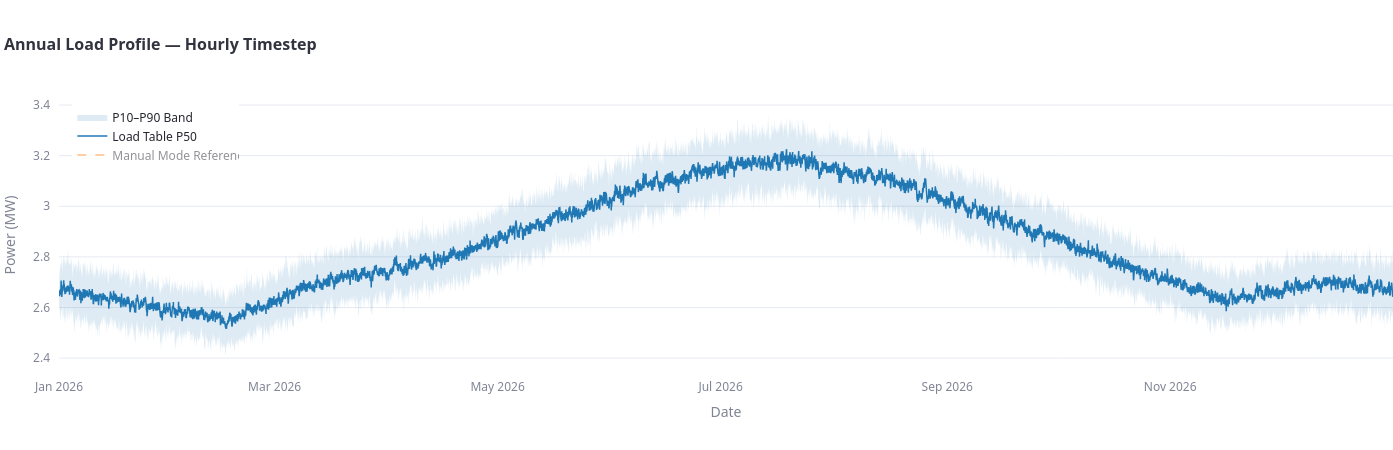
Auxiliary load over the year
Annual load profile, hourly timestep · P50 line and P10–P90 band
Mean2.84 MW
Minimum2.51 MW
Maximum3.23 MW
Std. deviation0.20 MW
Peak P10 / P50 / P903.13 / 3.23 / 3.37 MW
Load factor88.1 %
The load · Auxiliary
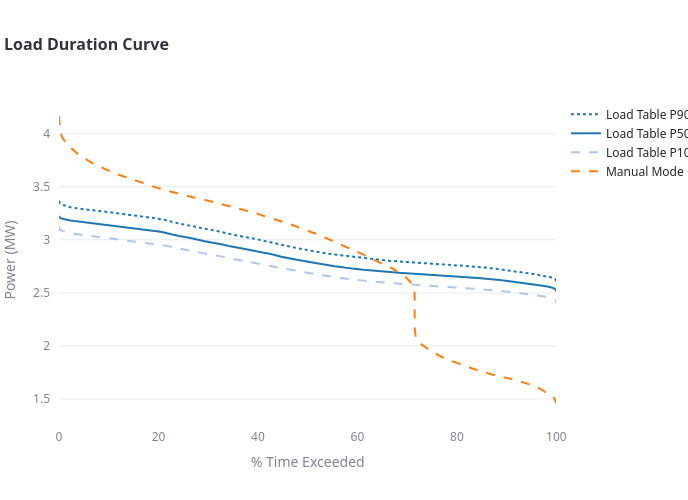
Load duration curve: peak and baseload
Load duration curve · P10, P50, P90 and manual-mode reference
Hourly range from the hourly case (5.27–7.24 MW). Minute range and ramps computed from the minute-resolution data of 23 July–5 August (load 4.86–10.03 MW, max step +3.94 / −4.19 MW per minute).
Stage 2 · Two turbines
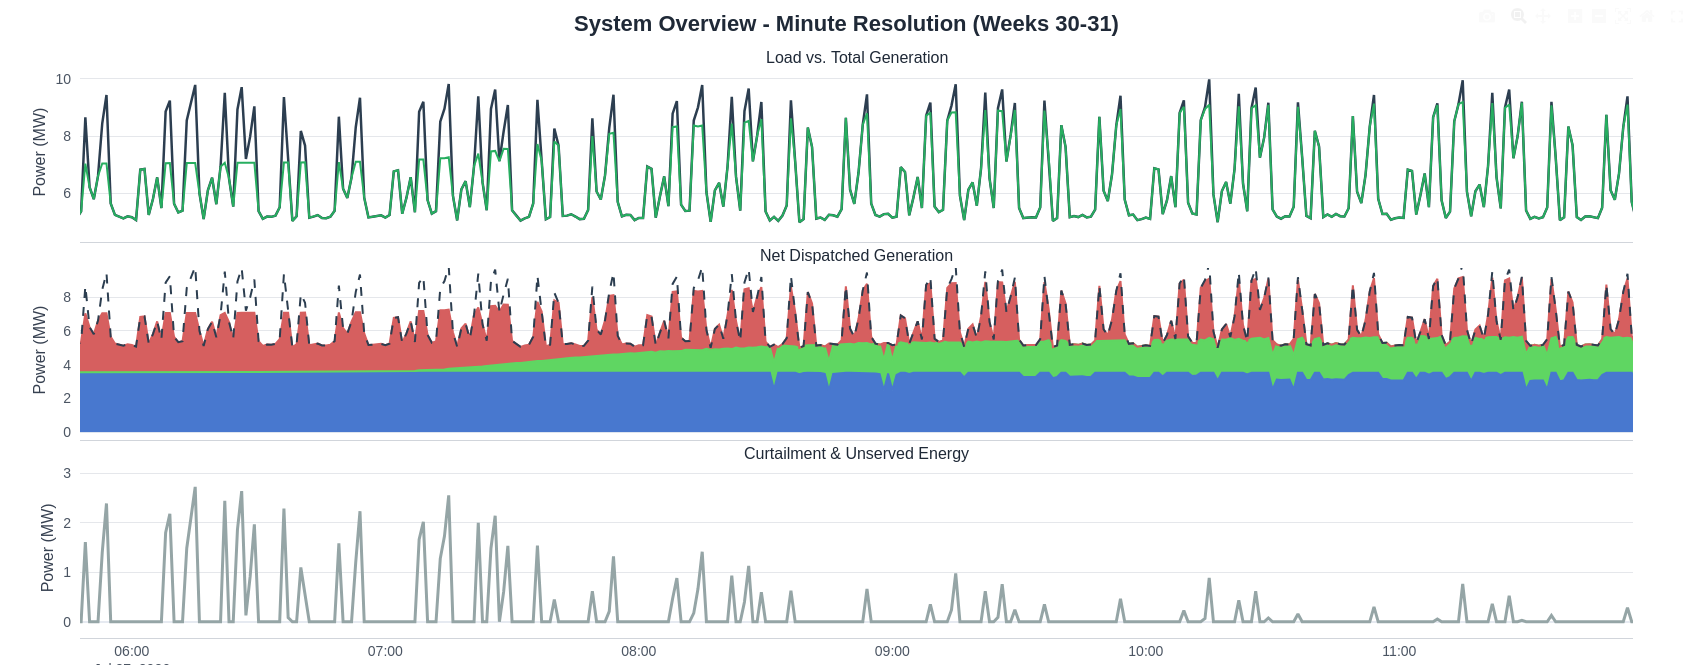
Two turbines at one-minute resolution
System overview, minute resolution, weeks 30–31 · interactive: zoom with the mouse, double-click to reset
Interactive chart from the minute-resolution run (20,160 points). Use the buttons or drag to zoom.
Stage 2 · Two turbines
Zoom on one morning: PV closes the gap
System overview, minute resolution · 27 July, 06:00–11:00
Stage 2 · Two turbines
System performance with two turbines
System adequacy
95.2 %
100 % in the hourly case
Unserved energy
106 MWh
of 2,193 MWh of demand
Largest unserved power
2.99 MW
in one minute
Minutes with unserved power
23 %
of the 14 days
PV used
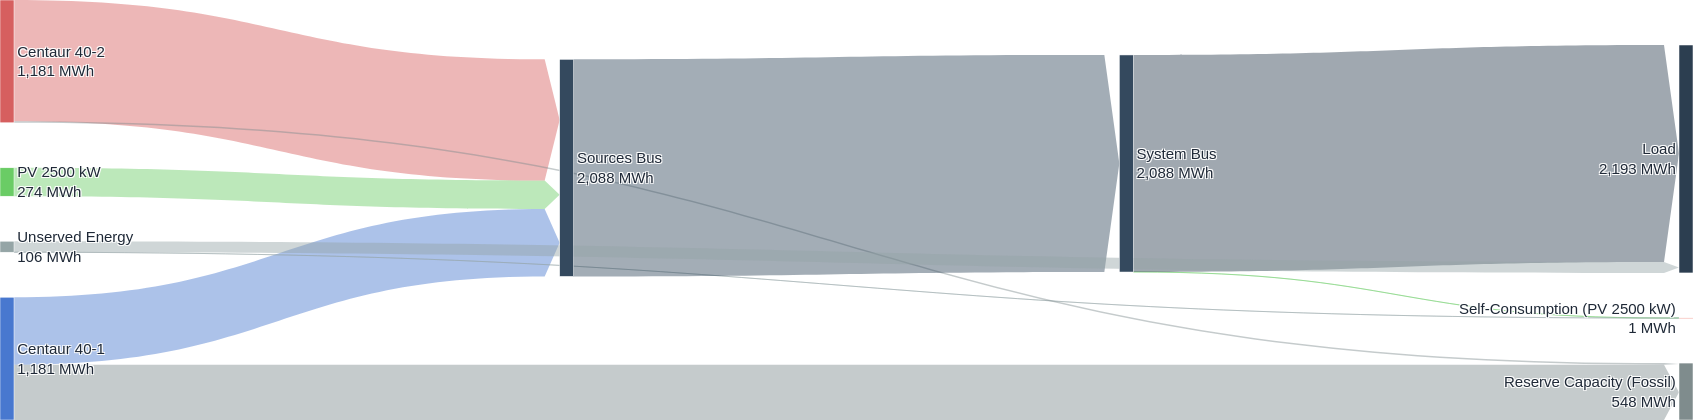
274 MWh
no curtailment
Capacity not used
548 MWh
turbine reserve
Native cards built from the revised energy-flow chart (served 2,088 MWh, unserved 106 MWh, PV 274 MWh, reserve 548 MWh) and the minute data (largest unserved power 2.99 MW; 23 % of the minutes with unserved power above 0.01 MW). They replace the earlier scorecard image, whose figures (2,236 MWh served, 113 MWh unserved) came from a previous run.
Stage 2 · Two turbines
Energy flow with two turbines
Energy flow overview · weeks 30–31 · two turbines
Revised chart: the source side now covers the whole 14 days (PV 274 MWh, turbines 1,181 MWh of capacity each), so the balance closes.
Stage 2 · Two turbines
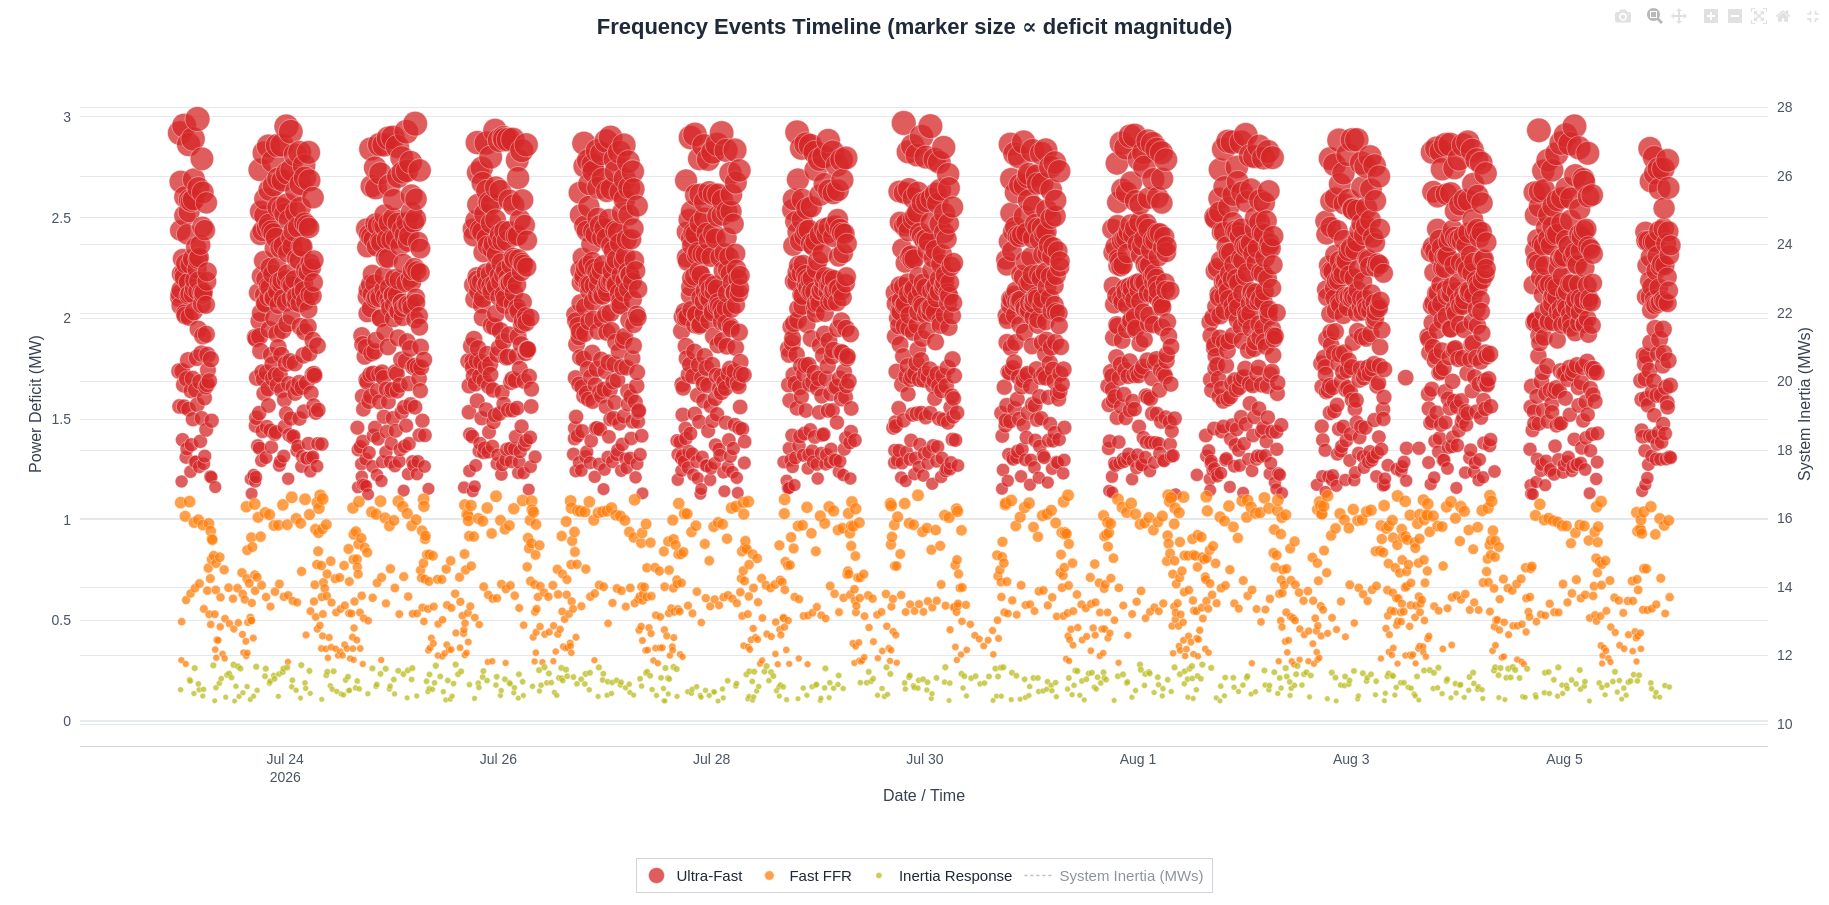
Frequency events: how fast must the response be?
Frequency events timeline · 23 July – 5 August · marker size is proportional to the deficit · right axis: system inertia
Category limits are read from the chart and from the minimum time-to-limit of each category (0.28 s, 0.50 s, 2.01 s). With inertia per timestep, the category of an event depends on both the deficit and the inertia of that minute.
Stage 2 · Two turbines
Event breakdown: most of the energy needs the fastest response
Frequency response requirements breakdown · two turbines
Response
Technology
Events
Unserved
Share
Ultra-fast
Power electronics, supercapacitors
≈ 2,766
90.7 MWh
86 %
Fast FFR
Batteries, flywheels, HVDC
1,175
13.4 MWh
13 %
Inertia response
Synchronous condensers, virtual inertia
495
1.5 MWh
1 %
Total
≈ 4,436
105.6 MWh
Values from the revised recap chart. The ultra-fast event count is clipped in the exported picture ("2,76..."); 2,766 is inferred from the total of 4,436 events, which is unchanged from the previous run (1,175 + 495 + 2,766). Check against the script output before presenting.
Stage 2 · Decision
What can close the gap?
With two turbines about 5 % of the energy is unserved, and almost all of it needs an ultra-fast or fast response.
Option A
Add a third turbine online
Capacity of 10.55 MW covers the 10 MW minute peak
More machines mean more capacity and more inertia at every minute
Three machines run at part load: more fuel per kWh
A third machine that the hourly study showed as idle
Next: three turbines at minute resolution →
Option B
Add a fast source: 1 MW / 1 MWh storage
Power electronics answer in tens of milliseconds
Covers the short, steep events
Does not add continuous capacity
Must be sized for power and energy
Then: two turbines plus storage →
Both options are tested at one-minute resolution with the inertia of each timestep: a third turbine, and two turbines with a 1 MW / 1 MWh battery.
Stage 2 · Three turbines
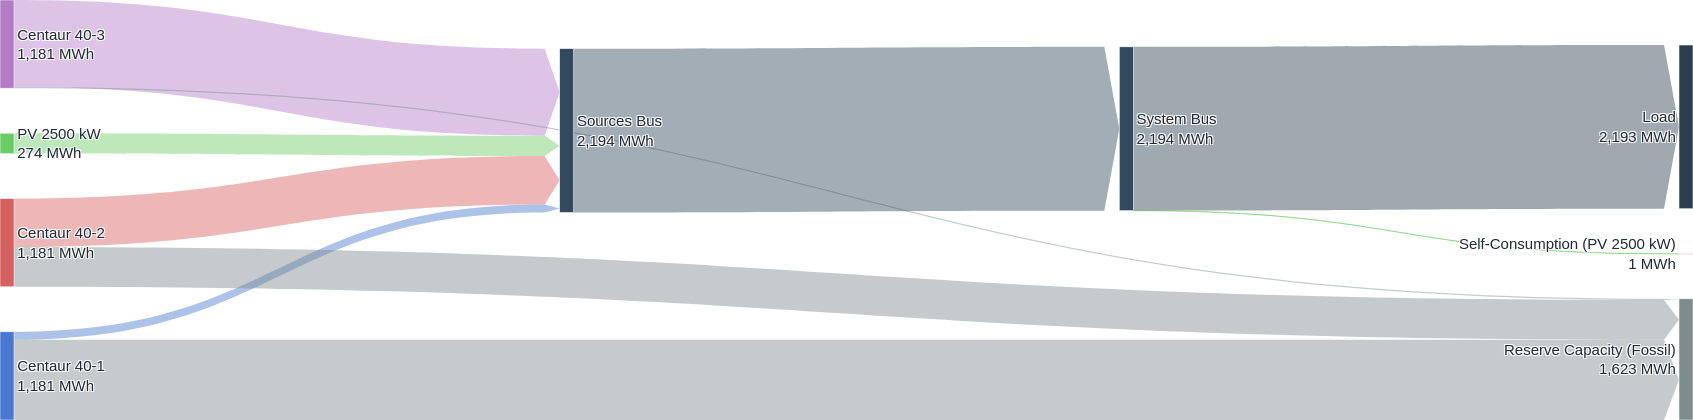
Three turbines: no unserved energy
Energy flow overview · weeks 30–31 · three turbines and PV
Revised result with inertia calculated at every timestep: with three turbines and PV there are no unserved events in the 14 days. The earlier run showed 14 MWh unserved and 32 MWh of PV curtailed; both are superseded. Loading = turbine dispatch (2,194 - 274 = 1,920 MWh) over turbine capacity (3 x 1,181 = 3,543 MWh); two turbines: 1,814 over 2,362 MWh.
Stage 2 · Two turbines + storage
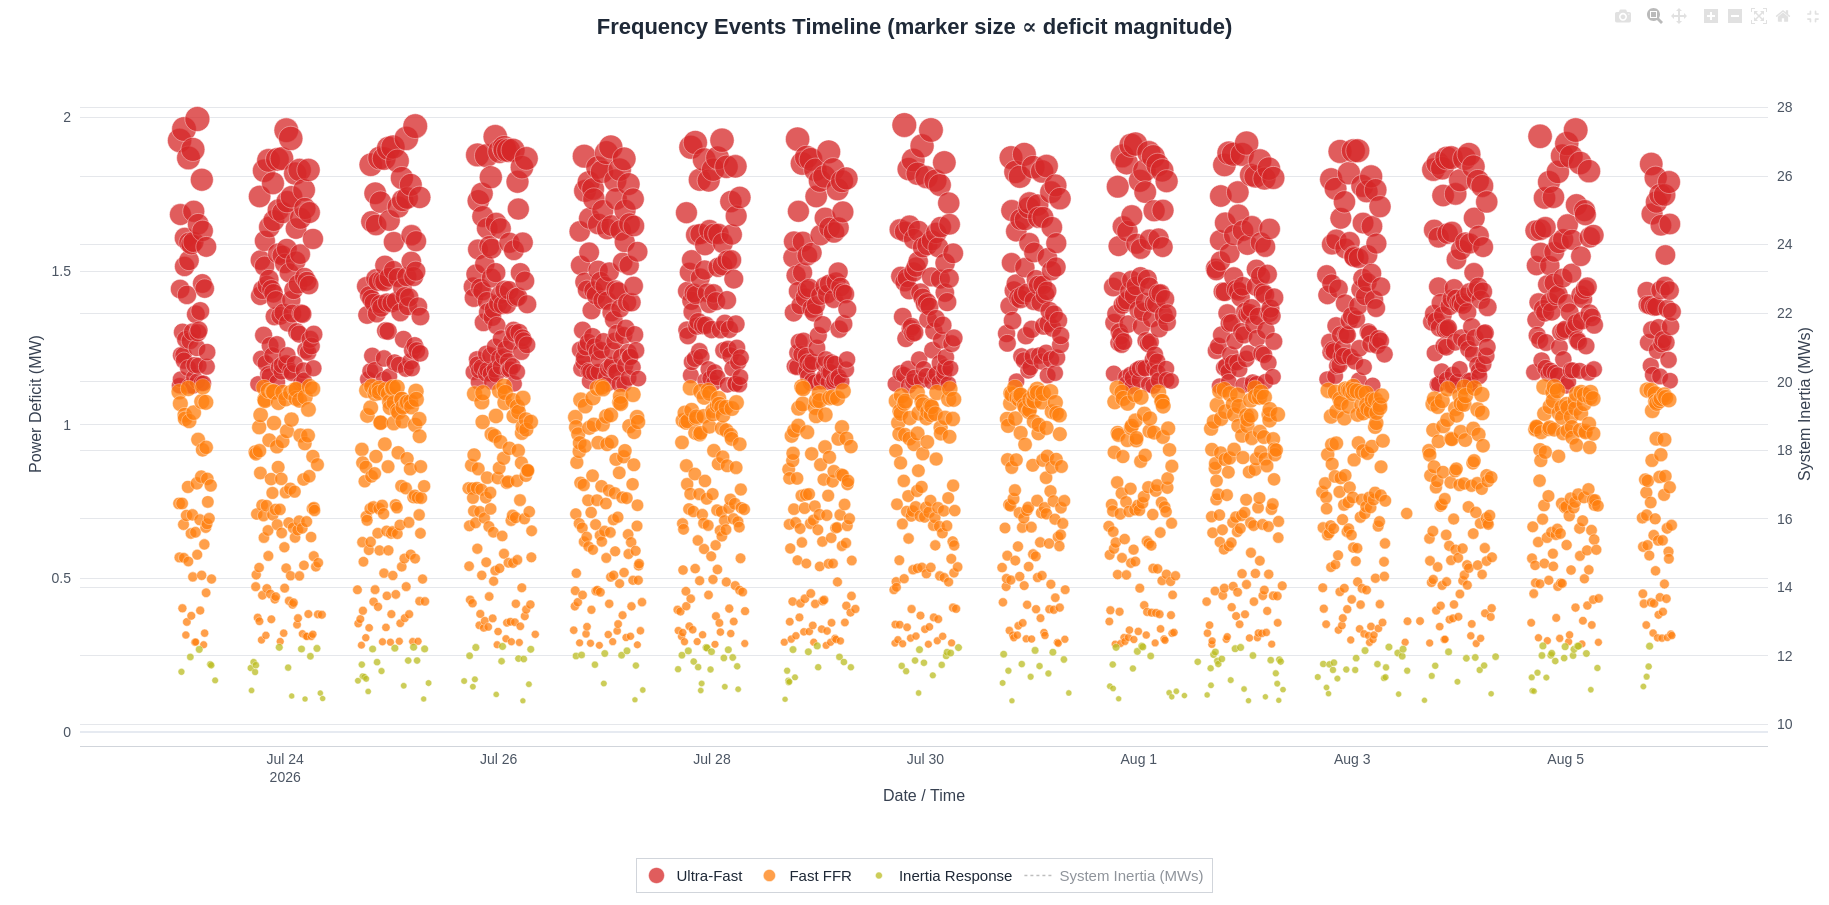
Two turbines with 1 MW / 1 MWh storage: events remain
Frequency events timeline · two turbines, PV and 1 MW / 1 MWh storage · right axis: system inertia
Storage of 1 MW / 1 MWh, with the inertia of each timestep.
Stage 2 · Two turbines + storage
What the battery removes, and what is left
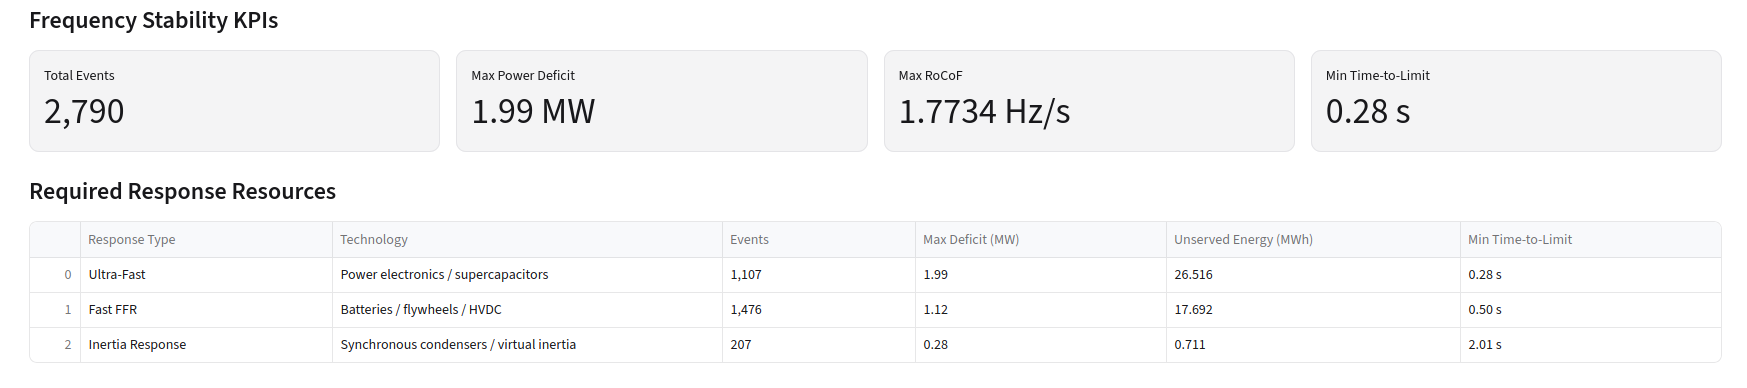
Frequency stability KPIs and required response resources · two turbines and 1 MW / 1 MWh storage
Unserved energy in 14 days
2 turbines105.6 MWh
2 turbines + 1 MW / 1 MWh44.9 MWh
3 turbines0 MWh
Values from the revised recap chart (two turbines, PV and 1 MW / 1 MWh storage): 2,790 events (1,107 ultra-fast, 1,476 fast FFR, 207 inertia); unserved energy 26.516 + 17.692 + 0.711 = 44.919 MWh; max deficit 1.99 MW; max RoCoF 1.7734 Hz/s. Adequacy about 98 % against 95.2 % without storage.
03
Loss of a source
What happens if a machine trips suddenly?
EventTrip of one turbine at peak load (N-1)
ResolutionMilliseconds around the event
UsesSystem inertia of that minute, fast headroom of each source
QuestionCan the frequency be arrested within its limit?
Stage 3 · Source loss
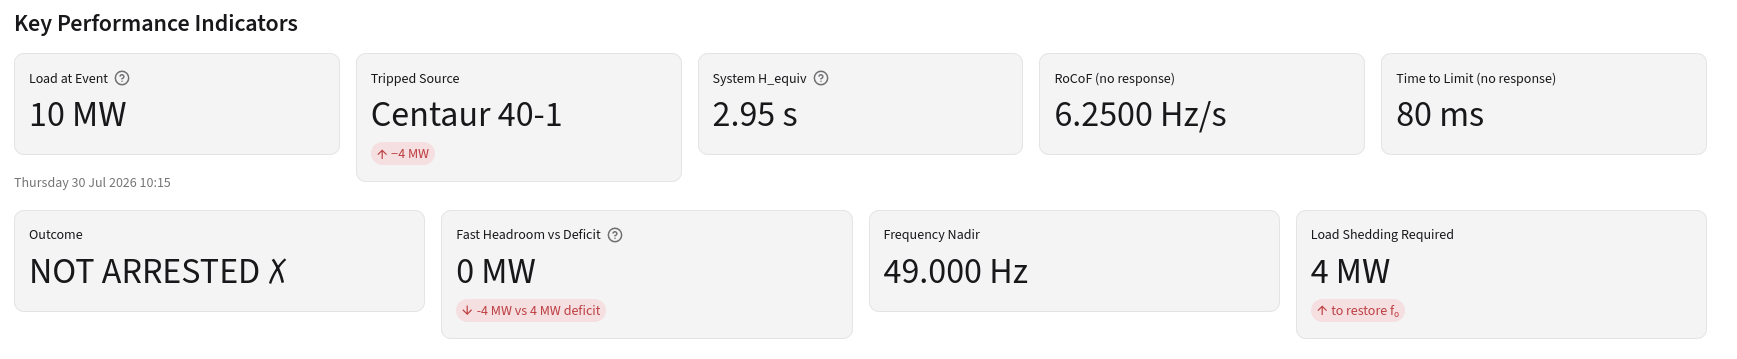
Losing a turbine at peak load (two turbines)
Key performance indicators · N-1 event · 30 July 10:15
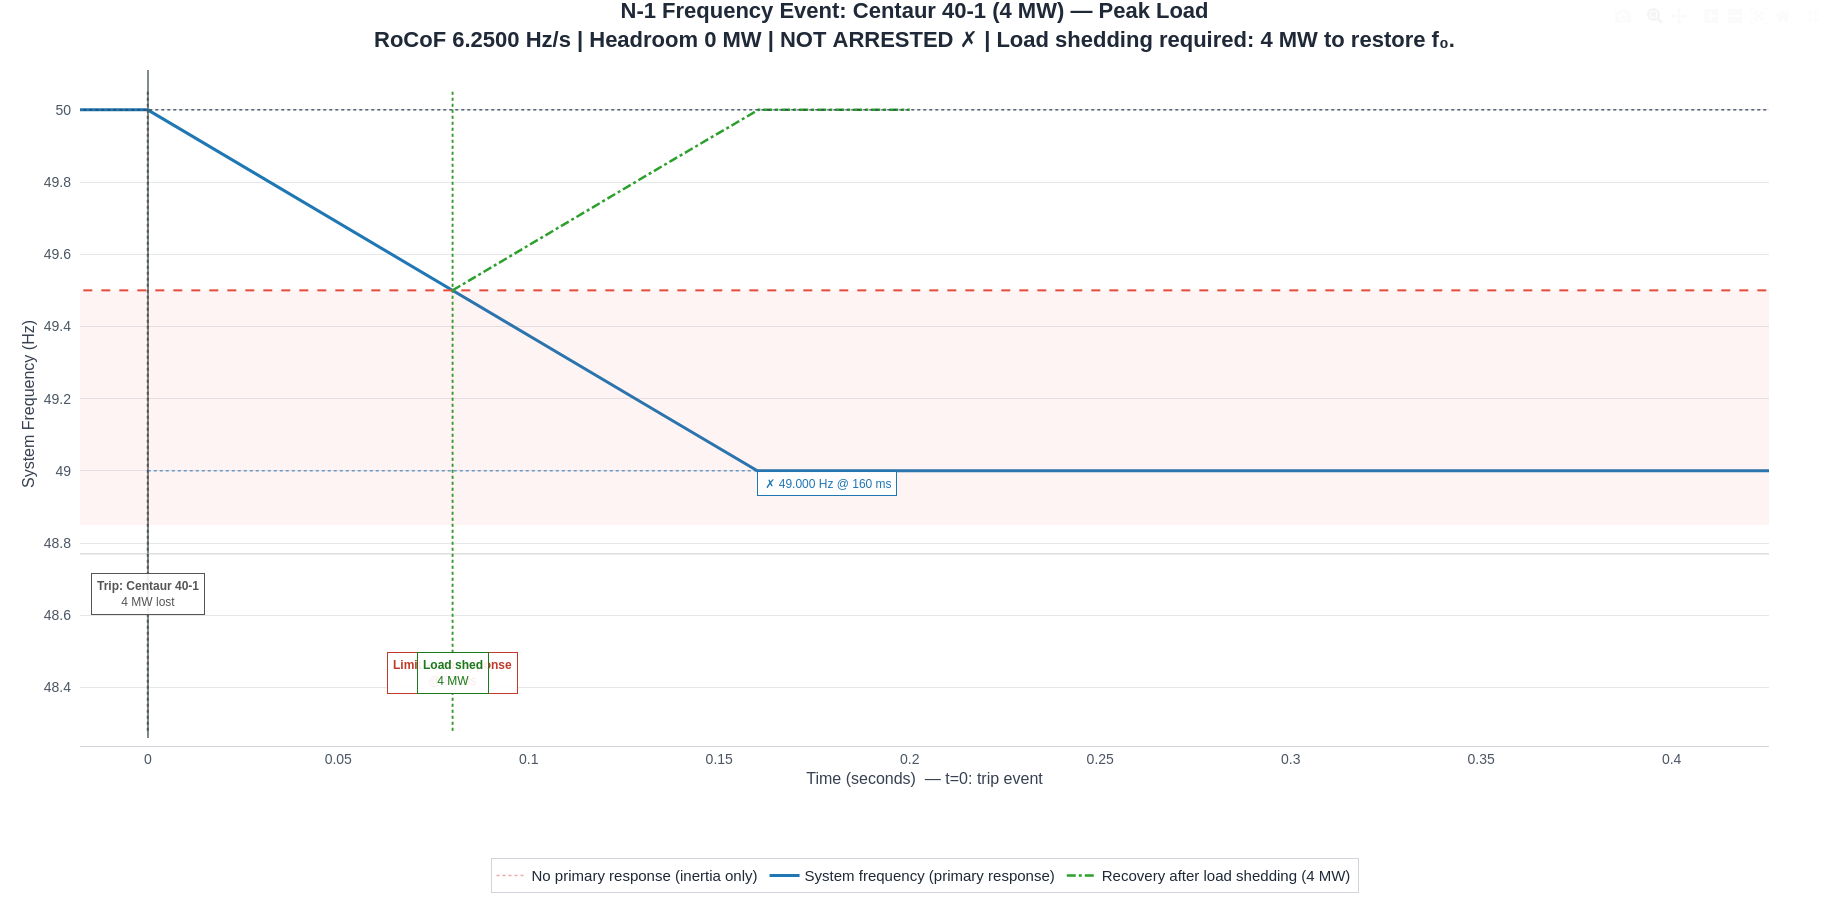
N-1 frequency event: Centaur 40-1 trips at peak load
RoCoF = rate of change of frequency. Time to limit = 0.5 Hz / RoCoF = 80 ms. Fast headroom is the power a source can deliver within that window; a ramp of a few MW per minute adds under 10 kW within 80 ms. Check: this chart was exported before the per-timestep inertia revision; regenerate it if the inertia of that minute has changed.
Stage 3 · Source loss
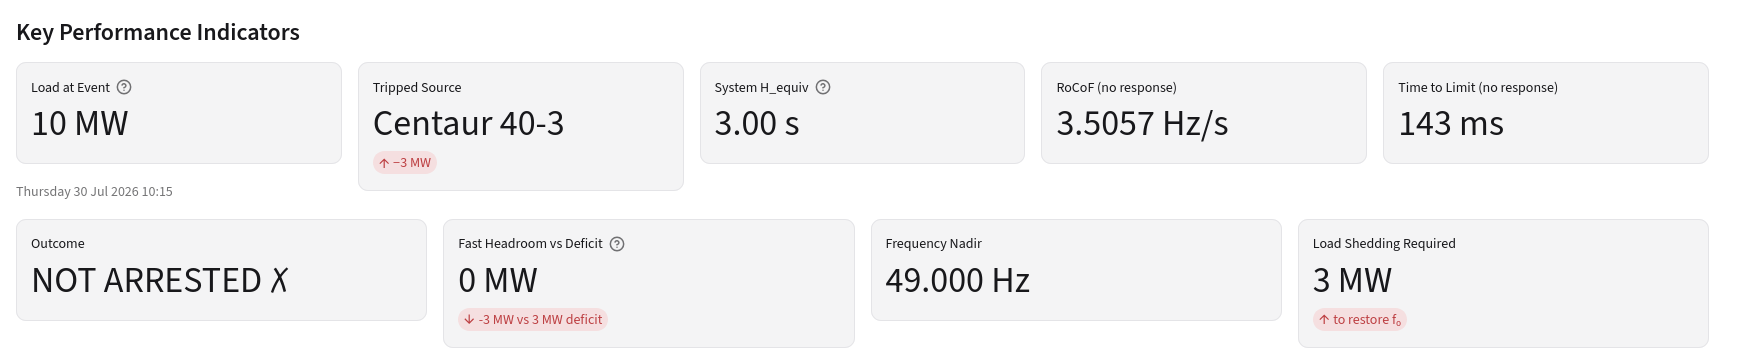
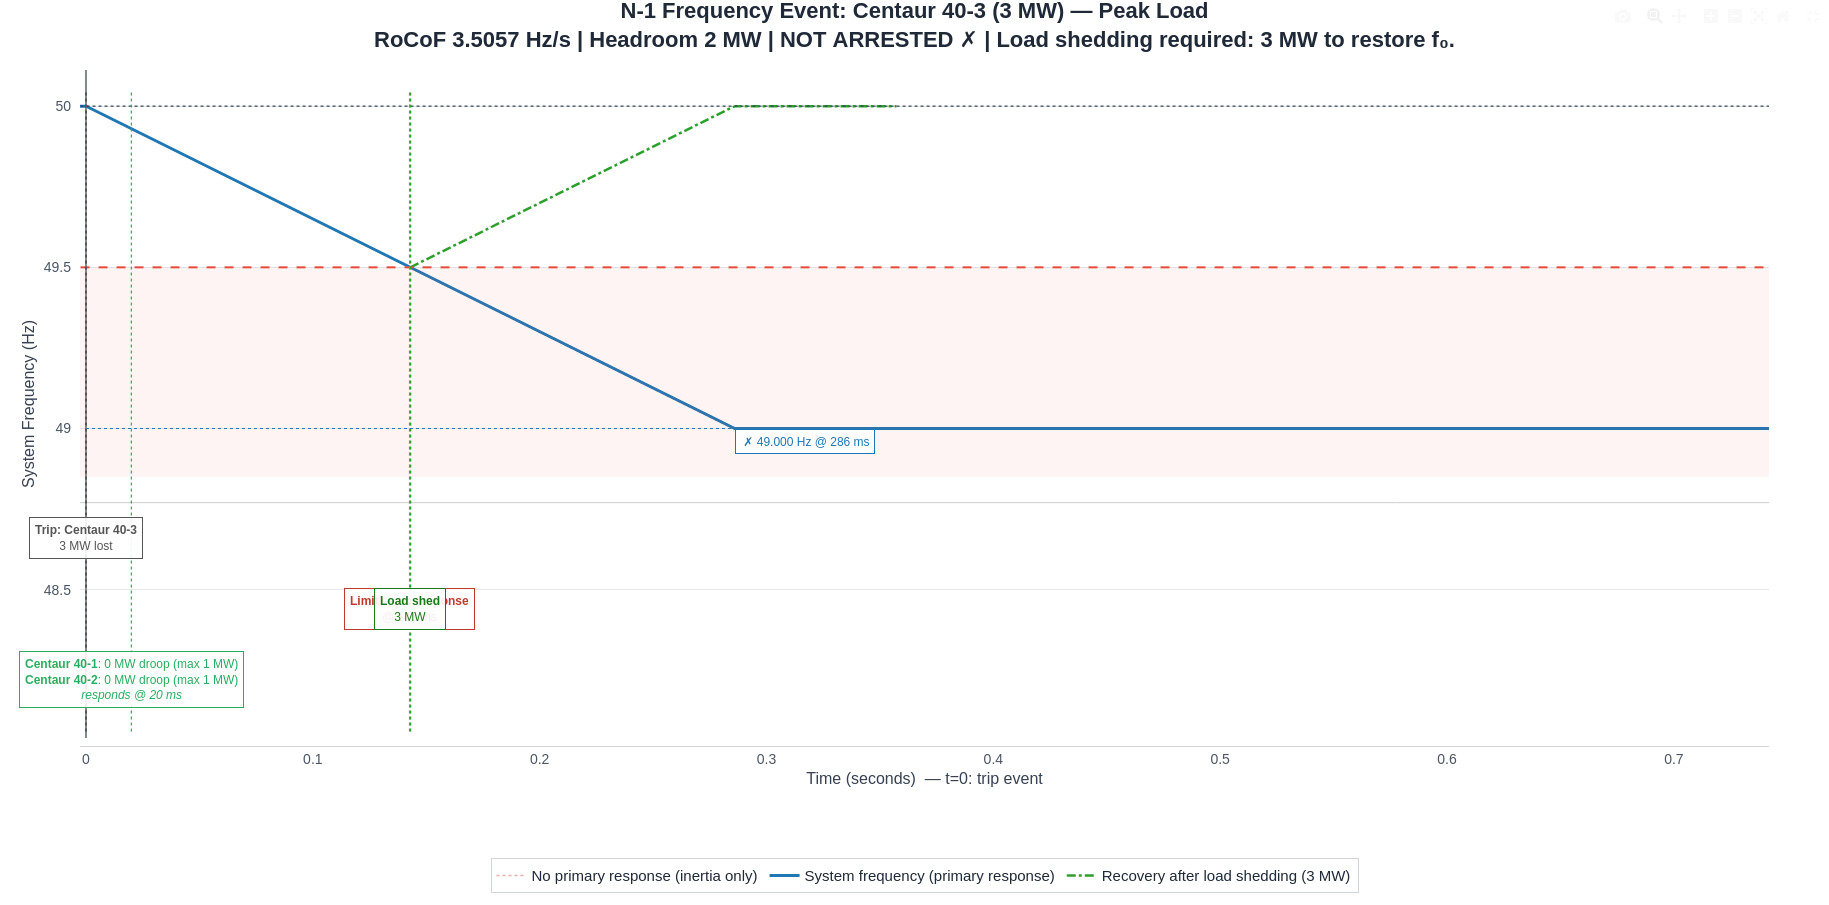
Losing a turbine at peak load (three turbines)
Key performance indicators · N-1 event · 30 July 10:15
N-1 frequency event: Centaur 40-3 trips at peak load
Fast headroom 0 MW against a 3 MW deficit. The chart title shows the total headroom of the survivors (2 MW); the KPI card shows the part of it available within the event. Check: exported before the per-timestep inertia revision.
Summary
The cases side by side
Each step solves one problem and exposes the next.
Case
Machines
Unserved energy
Events by response
Largest deficit
Loss of a source
Hourly (full year)
2 of 3 dispatched
0 MWh
not assessed
–
not assessed
Minute, 2 turbines
2, loaded 77 %
106 MWh (4.8 %)
≈ 2,766 ultra-fast · 1,175 FFR · 495 inertia
2.99 MW
Not arrested · shed 4 MW
Minute, 2 turbines + 1 MW / 1 MWh storage
2 + battery
45 MWh (2.0 %)
1,107 ultra-fast · 1,476 FFR · 207 inertia
1.99 MW
not tested
Minute, 3 turbines
3, loaded 54 %
0 MWh
no unserved events
–
Not arrested · shed 3 MW
Window14 days of minute data, 23 Jul – 5 Aug
Frequency limit49.5 Hz
System inertiacalculated at every minute
Source losstested at peak load, 30 July
Unserved energy: 105.6 MWh of 2,193 MWh (4.8 %) with two turbines; 44.9 MWh (2.0 %) with storage; 0 with three turbines. Loading = turbine dispatch over turbine capacity in the energy-flow charts. The source-loss tests were run at peak load for two and three turbines; they were not repeated for the storage case.
Conclusions
What the staged methodology tells us
1
Hourly: two Centaur 40 and 2,500 kW of PV supply 100 % of the 54 GWh a year. The third turbine is not needed for energy.
2
Minute, two turbines: 10 MW minute peaks above the 7.03 MW of two machines plus PV leave 106 MWh (4.8 %) unserved in 4,436 events, 86 % of it in ultra-fast events.
3
Two turbines + 1 MW / 1 MWh storage: unserved energy falls by 57 % and the largest deficit from 3.0 to 2.0 MW, but 2,790 events remain.
4
Three turbines: no unserved events at all, with the PV fully used. The machines run at 54 % average loading instead of 77 %.
5
Loss of a source: not arrested with two or three turbines at peak load. It needs its own solution.
← → navigate · O overview · F fullscreen · N notes